


At a modelled nightly rate of PKR 35,000, a short-term rental apartment with 60% annual occupancy would generate about PKR 6.39 lakh in average monthly booking revenue. Apply the video’s 40% operating-cost assumption and then allocate 70% of the remaining amount to the owner, and that owner’s share becomes approximately PKR 2.68 lakh a month.
That is the starting point for understanding short term rental yield in Pakistan. A headline percentage only becomes useful when the income, deductions, occupancy and investment amount behind it are visible.
In Imlaak’s video, Short Term Rental in Pakistan | Can Rental Income Reach 15%?, published on 26 September 2026, the example considers how a proposed rental operation at Sixty6 Gulberg could perform. The figures are forward-looking assumptions, rather than an operating history or a promised return.
The short answer: using the video’s quoted apartment-price range of PKR 2.25 crore to PKR 2.50 crore, the reconstructed model produces an annual owner-distribution yield of approximately 15.02% to 16.69% at 70% occupancy. At 60% occupancy, the corresponding range is lower, at 12.88% to 14.31%. These percentages use the quoted property price before any additional investment costs or owner-level deductions.
The assumptions behind the rental-income model
The video discusses premium Gulberg nightly-rate observations around PKR 30,000 to PKR 40,000 and uses approximately PKR 35,000 as its working example. Those are the video’s assumptions and observations; they should not be treated as a verified current tariff for every apartment, booking date or property category.
The calculation also relies on occupancy scenarios from 30% to 70%, approximately 40% operating expenses, and a 70/30 owner/operator split after those expenses. A long-term rental figure of about PKR 1.5 lakh a month provides the video’s comparison point.
| Input | Working assumption | How to interpret it |
|---|---|---|
| Nightly rate | PKR 35,000 | Modelled average rate per occupied night |
| Occupancy | 30% to 70% | Alternative annual scenarios, not reported results |
| Operating expenses | 40% of gross rental revenue | Model allowance requiring an itemised budget |
| Owner share | 70% after operating expenses | Equivalent to 42% of gross under these assumptions |
| Operator share | 30% after operating expenses | Equivalent to 18% of gross under these assumptions |
| Calendar basis | 365 days a year | Used here to derive annual figures and monthly averages |
The price range discussed at approximately 5:45 in the video is PKR 2.25 crore to PKR 2.50 crore. It provides the denominator for the yield comparisons below. It is a historical reference from that discussion, not confirmation of a current quotation or a complete acquisition budget.
Using 365 days matters. A monthly average is annual income divided by 12; it is not the income of a fixed 30-day month. This approach reproduces the video’s approximately PKR 2.68 lakh owner-income example at 60% occupancy. Actual monthly payments could vary.
How gross revenue becomes the owner’s share
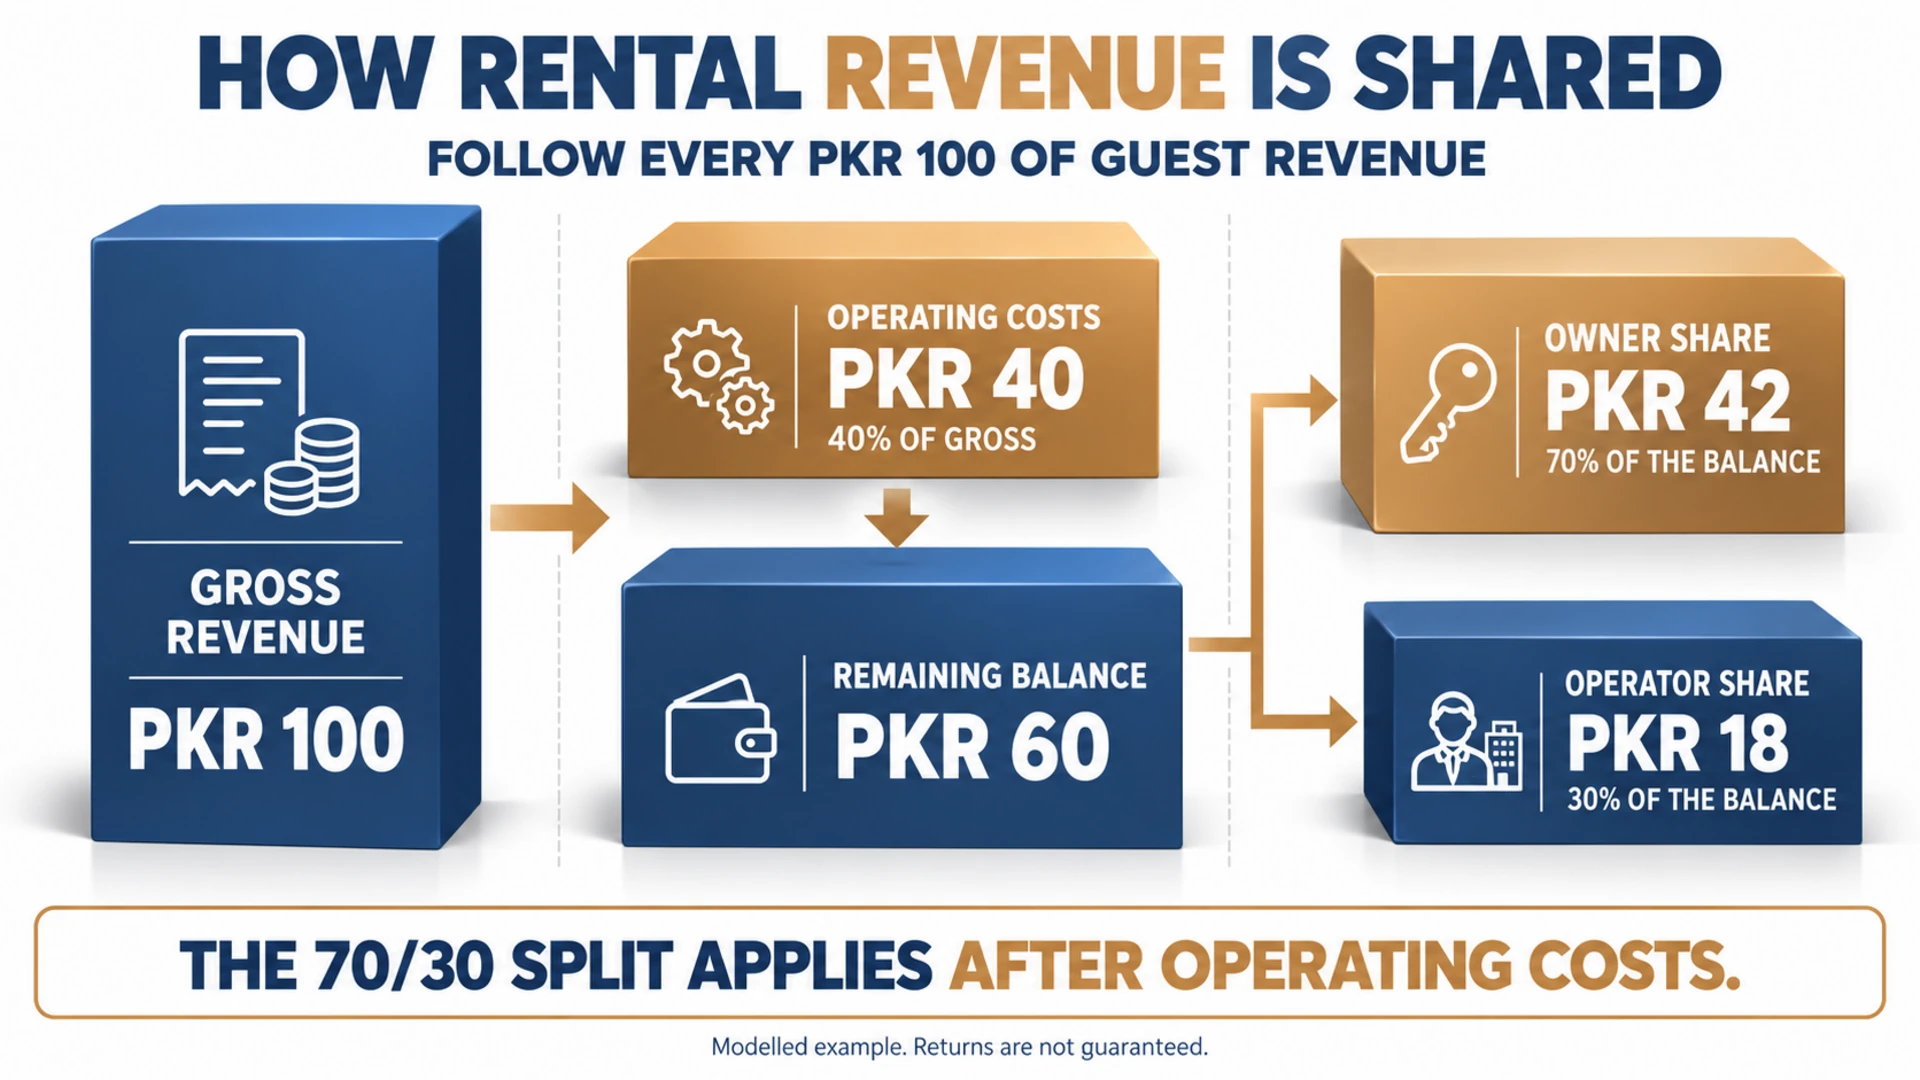
The order of deductions is central to the model. First, guests generate gross rental revenue. Next, operating expenses are deducted. The remaining balance is then divided between the owner and operator.
For every PKR 100 of gross revenue, the model allocates PKR 40 to operating expenses. The remaining PKR 60 is split 70/30: PKR 42 goes to the owner and PKR 18 to the operator.
Owner share = gross revenue × 60% remaining after expenses × 70% owner allocation.
This produces an effective owner share of 42% of gross revenue. Applying 70% directly to gross bookings would overstate the owner’s amount because it skips the operating-cost deduction.
It is also important to distinguish this modelled owner distribution from an investor’s final net cash return. The operating agreement must establish which expenses fall inside the 40% allowance and which, if any, are paid separately by the owner. Financing, taxes or replacement expenditure should not silently disappear from the analysis, nor should an expense already included in the operating budget be deducted twice.
What happens as occupancy changes?
Occupancy determines how often the modelled nightly rate earns revenue. At the same rate, an apartment that is booked on 60% of available nights generates twice the gross revenue of one booked on 30% of nights.
The following table keeps the nightly rate, expense ratio and revenue-sharing structure unchanged. The 50% row is an additional calculation for comparison. These are mathematical scenarios, not a forecast of the order in which occupancy will improve.
| Annual occupancy | Average monthly gross | Average monthly owner share | Annual owner share |
|---|---|---|---|
| 30% | PKR 3.19 lakh | PKR 1.34 lakh | PKR 16.10 lakh |
| 40% | PKR 4.26 lakh | PKR 1.79 lakh | PKR 21.46 lakh |
| 50% | PKR 5.32 lakh | PKR 2.24 lakh | PKR 26.83 lakh |
| 60% | PKR 6.39 lakh | PKR 2.68 lakh | PKR 32.19 lakh |
| 70% | PKR 7.45 lakh | PKR 3.13 lakh | PKR 37.56 lakh |
All figures are derived from PKR 35,000 × 365 days × occupancy. Owner share is 42% of gross. Monthly figures are annual averages. Values are rounded; one lakh equals PKR 100,000.
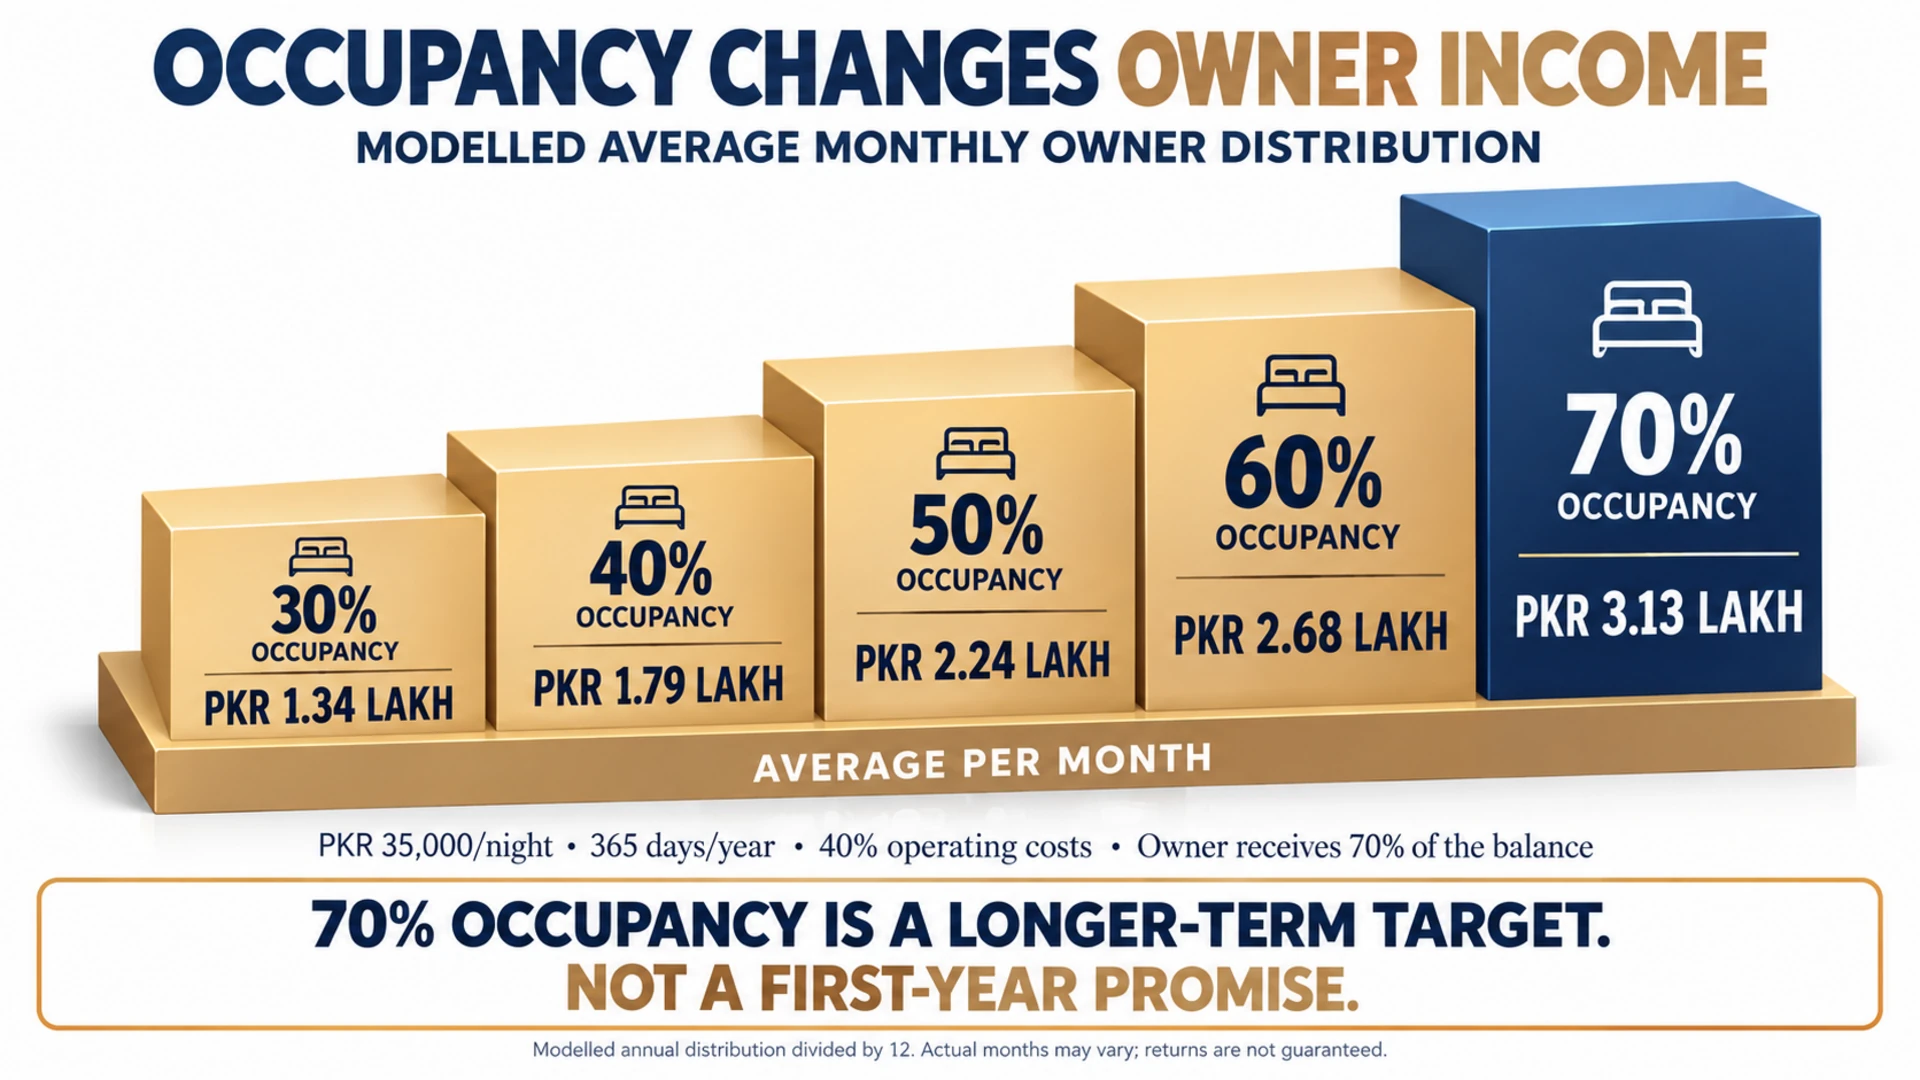
The 60% scenario produces PKR 7,665,000 in annual gross revenue. Deducting the modelled operating expenses leaves PKR 4,599,000. The owner’s 70% share of that balance is PKR 3,219,300 a year, or PKR 268,275 a month on average.
The video presents 70% occupancy as a potential longer-term operational target, discussing the second or third operating year rather than the first. It should not be inserted into a first-year cash-flow plan as an established result. Equally, 30% is a lower scenario in the analysis, not a guaranteed minimum. A new operation needs evidence on bookings, achievable rates, operating readiness and the time required to build demand.
Testing 15% against the quoted apartment prices
A monthly income figure alone cannot establish a rental yield. The calculation also needs a clearly defined investment amount and an annual period.
Annual owner-distribution yield = annual owner share ÷ invested capital × 100.
Applying the reconstructed owner income to the video’s PKR 2.25 crore to PKR 2.50 crore apartment-price range produces the following results:
| Occupancy | At PKR 2.25 crore | At PKR 2.50 crore |
|---|---|---|
| 30% | 7.15% | 6.44% |
| 40% | 9.54% | 8.58% |
| 50% | 11.92% | 10.73% |
| 60% | 14.31% | 12.88% |
| 70% | 16.69% | 15.02% |
These are annual owner-distribution yields on quoted property prices, before any extra investment costs or owner obligations. They are not monthly yields or verified net returns.
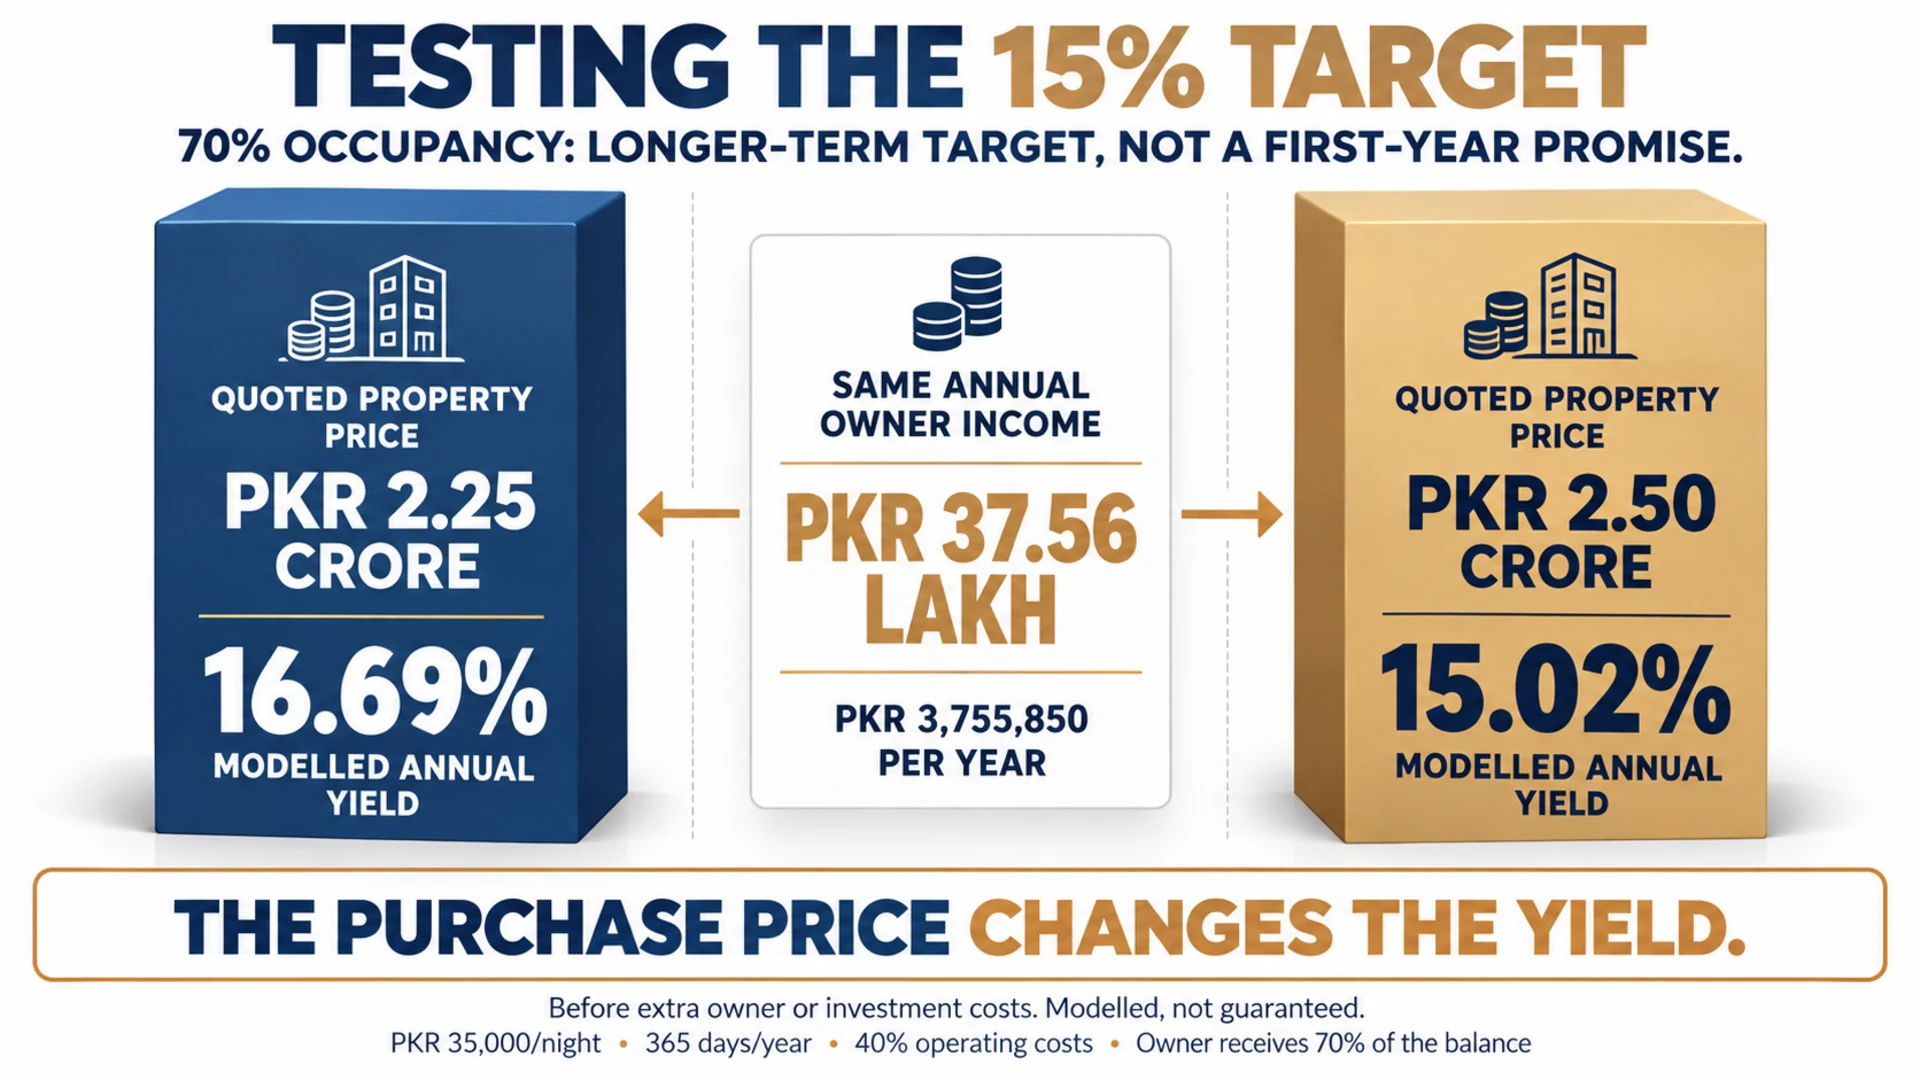
The distinction matters when reading the source’s rounded discussion. At 40% occupancy, the consistent model gives approximately 8.58% to 9.54% a year. At 60%, it gives approximately 12.88% to 14.31%. The 15% threshold is reached in the 70% scenario across the quoted price range, subject to the model’s assumptions and exclusions.
The same formula gives approximately PKR 3.13 lakh in average monthly owner distributions at 70% occupancy. All figures in the tables are calculated first and then rounded, so the numbers can be compared consistently across scenarios.
Another way to test the target is to work backwards. PKR 3,755,850 in annual owner distributions divided by 15% gives a capital base of PKR 25,039,000, approximately PKR 2.504 crore. That is a derived mathematical threshold, not a new property quotation. If the all-in investment exceeds it, or further owner costs reduce the income, the yield drops below 15% under the same operating scenario.
Rental yield also needs to stay separate from capital appreciation. An expected rise in property value is not rent received. Combining the two creates a total-return estimate, which answers a different question from whether the rental operation itself can deliver 15%.
Use the full investment cost
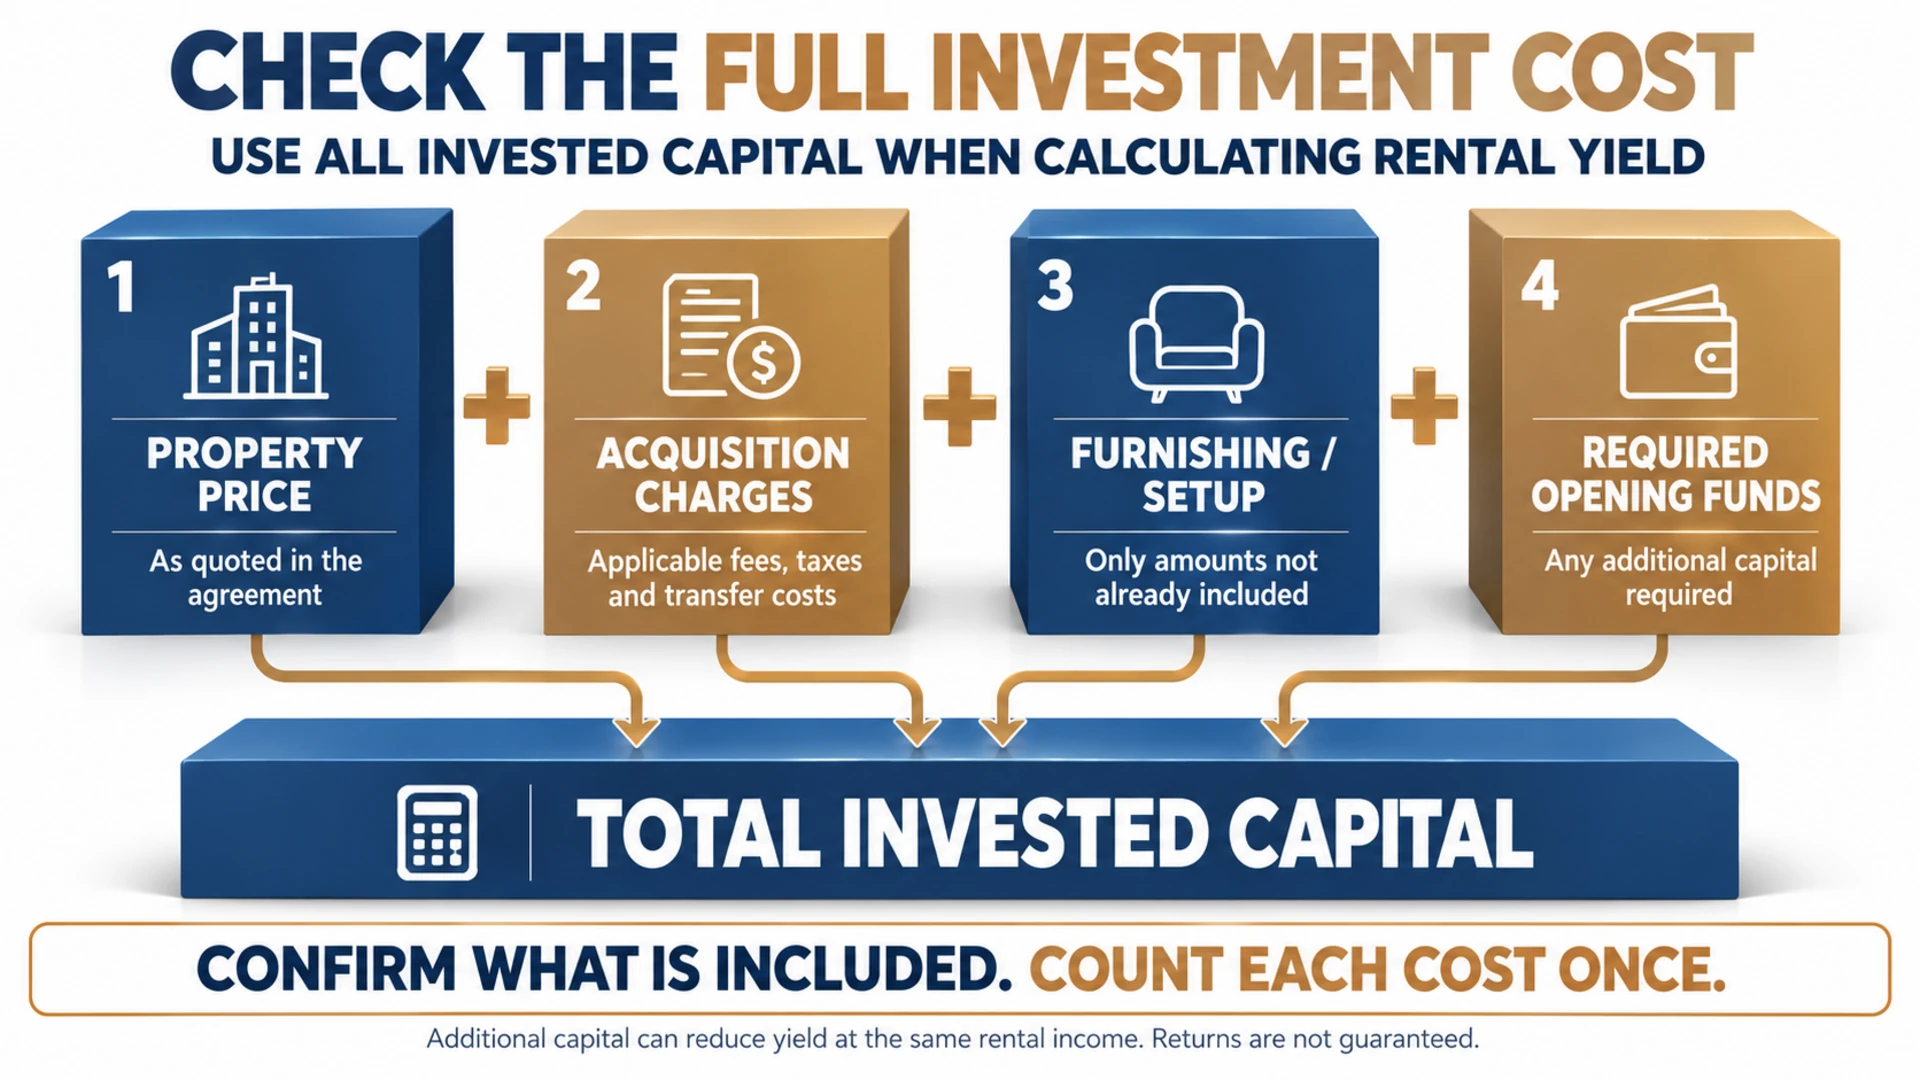
Before applying a yield percentage to a purchase, write down the actual capital required to reach rental readiness. A property price may be only one component of that amount.
- Property acquisition: the agreed price and acquisition charges payable by the investor.
- Rental setup: furnishing, equipment and other preparation required by the operating model, where these are not already included.
- Opening funds: any required cash contribution or reserve that forms part of the investor’s committed capital.
- Further contributions: any additional amounts required by the purchase or operating agreement.
Obtain a written breakdown and mark what is already included. This avoids both understating the total investment and counting the same setup expense twice. The video does not supply a complete, buyer-specific all-in acquisition budget.
Timing deserves its own check. An annual operating yield describes income once the rental operation is running under the stated assumptions. It does not account automatically for money committed before possession, setup delays or periods before guests can be accepted. A cash-flow plan should show when capital goes out and when distributions are expected to begin.
Nightly rates and costs can change the outcome
Occupancy is only one part of the calculation. The nightly rate actually collected is equally important. A displayed asking rate should not automatically become the model’s achieved average; discounts, the mix of bookings and the periods available for sale need to be reflected in the operator’s assumptions.
The mathematical relationship is straightforward. At fixed occupancy and unchanged percentage deductions, a 10% reduction in the average nightly rate produces a 10% reduction in gross revenue and the modelled owner share. A target occupancy achieved only through lower prices should therefore be tested with that lower average rate.
The 40% cost allowance needs equal scrutiny. Request its inclusions, exclusions and treatment of expenses that do not fall when bookings decline. If some costs are fixed, applying the same expense percentage to every occupancy scenario can conceal pressure in a weak month.
The video explicitly allows that the expense ratio could be 35% or 45% rather than exactly 40%. As a sensitivity check, raising it from 40% to 45% at 70% occupancy reduces the modelled owner share from about PKR 3.13 lakh to PKR 2.87 lakh a month. On a PKR 2.50 crore property-price base, the annual yield falls from 15.02% to approximately 13.77%. This is a recalculation of the source assumptions, not an estimated expense quote.
The discussion includes electricity, booking charges, utilities and salaries within its expense allowance. The video description also identifies variables such as maintenance, taxation and operator performance. An investor should ask which of these are covered by the operating budget, which are separately payable, and how they appear in owner statements. No additional fee rate or tax rate is assumed in this article.
How does the example compare with long-term rent?
The video’s long-term comparison is approximately PKR 1.5 lakh a month. Against that figure, the modelled short-term owner share at 30% occupancy is lower, at approximately PKR 1.34 lakh. At 40%, it is higher, at approximately PKR 1.79 lakh.
Using the same formula, the short-term model reaches PKR 1.5 lakh in average monthly owner distributions at approximately 33.5% annual occupancy. This is a derived comparison point, not an operating break-even or a guaranteed minimum occupancy.
A fair comparison still requires both rental options to use the same capital base and cost treatment. Determine whether the long-term figure is the landlord’s rent before any owner costs, whether furnishing requirements differ, and who carries maintenance and vacancy costs under each agreement.
For an explanation of the operating approach, see Imlaak’s earlier guide to short-term rental management in Lahore. That older article provides context; its historical income examples are not inputs to the model examined here.
What must be checked at project and operator level?
The video uses Sixty6 Gulberg as the project context for a future managed-rental model. In the September 2026 discussion, the proposed operating start is 2027. That is the plan described in the source, rather than confirmation that rental operations have begun or that every unit is rental-ready.
A useful investment assessment should examine the property and operating arrangement separately, then test how the two work together. The presenter identifies the analysis as Imlaak’s own estimates and explicitly distinguishes them from developer or operator guarantees.
First, establish rental readiness: possession, the work required before guests can stay, and the conditions for entering the rental operation. Then establish the commercial structure: how bookings and expenses are recorded, how the owner receives a distribution, and what reporting supports each payment.
Where a rental pool is proposed, ask how pool income is allocated to individual owners, which units participate, and how owner use or a unit being unavailable affects its allocation. A building-wide occupancy figure and the distribution credited to one owner may require different calculations under the agreement.
Imlaak’s explanation of developer selection and investment advisory provides a useful framework for reviewing capacity, contracts, commercial structure and reporting. Those checks are especially relevant when future operating assumptions are an important part of the purchase decision.
Questions to ask before relying on the return
- What exactly is the rate assumption? Request the accommodation category, average realised rate and evidence supporting it.
- What occupancy is expected in each period? Keep the first operating year separate from a later stabilised target.
- What does the operating budget include? Obtain the expense categories and identify separate owner obligations.
- How does the owner/operator split work? Confirm the sequence of deductions and the contract’s definition of distributable revenue.
- What is the all-in capital requirement? Include the amounts needed to acquire and prepare the unit for the proposed rental operation.
- How will performance be verified? Ask for booking, revenue, expense and distribution reports, together with the reporting timetable.
- What happens if assumptions are missed? Review owner-use rules, repairs, downtime and termination or exit provisions before committing.
For a broader due-diligence perspective, read Imlaak’s investor protection guide for Pakistan real estate. Obtain appropriate professional advice on the documents and obligations that apply to the specific investment.
The useful conclusion behind the 15% question
The video offers a way to test how short-term rental income could develop as occupancy improves. Its proposed expense and revenue-sharing structure converts 42% of gross revenue into the modelled owner’s share. At PKR 35,000 per occupied night, the annual owner share ranges from approximately PKR 16.10 lakh at 30% occupancy to PKR 37.56 lakh at 70%.
A 15% rental-income claim becomes meaningful only after that owner’s income is matched to a defined capital base and adjusted for any further costs. Stronger occupancy, disciplined operating costs and an appropriate purchase budget all affect the result. None is established simply by putting 15% in a headline.
How Imlaak can help: Contact Imlaak to discuss the assumptions behind a rental-income proposal. Bring the unit price, setup budget and proposed operating agreement so the income model can be considered alongside the actual terms.
Frequently asked questions
Can short-term rentals in Pakistan generate 15% rental yield?
A 15% figure is mathematically possible under the video’s stronger operating assumptions and a suitable investment amount. It is not established as an achieved or guaranteed result. The calculation needs actual capital committed, achieved income and all relevant owner costs.
Is the owner’s 70% share calculated on gross revenue?
No. The video applies the 70/30 split after the modelled 40% operating expenses. The owner’s share therefore equals 42% of gross revenue under those assumptions.
What does 60% occupancy produce in this example?
At PKR 35,000 per occupied night over a 365-day year, 60% occupancy produces PKR 7,665,000 in annual gross revenue and PKR 3,219,300 in modelled annual owner distributions. The average monthly owner amount is PKR 268,275.
Should investors assume 70% occupancy in the first year?
The video describes 70% as a potential longer-term target. A first-year plan should use separately supported assumptions for operating readiness, bookings and pricing rather than automatically adopting that target.
Does the model include a rise in property value?
The rental-yield calculations in this article use rental distributions only. Capital appreciation would be a separate component of total return and should not be counted as rental income.
Source and calculation note: This article is based on the timestamped transcript and published description of the Imlaak video published on 26 September 2026, including the rate discussion at 2:22, costs and revenue sharing at 3:24–4:29, price range at 5:45, higher-occupancy scenarios at 6:22–7:37, and disclaimer at 10:16. Tables and sensitivity calculations are derived using a consistent 365-day annual basis and rounded for readability; they clarify differences in the source estimates. All operating outcomes are illustrative. Actual results may be materially higher or lower.